
AI电子表格可视化
5|0 reviews|0 favorites
Introduction
Use AI and other large language models to automatically explore data and generate visualizations and infographics from spreadsheets.
Listed on
July 23, 2026
What is AI电子表格可视化?
AI Spreadsheet Visualization is a tool for generating data visualizations and data-faithful infographics. It works with any programming language and visualization library, such as matplotlib, seaborn, altair, d3, etc., and collaborates with multiple large language model providers (PaLM, Cohere, Huggingface). It consists of 4 modules: a SUMMARIZER that converts data into rich but compact natural language summaries, a GOAL EXPLORER that enumerates visualization goals for given data, a VISGENERATOR that generates, refines, executes, and filters visualization code, and an INFOGRAPHER module that generates data-faithful stylized graphics using IGM.
How to use AI电子表格可视化?
- After installing the extension, users can directly open spreadsheet data in the browser, automatically explore the data with AI, and generate visualizations. Users can select different visualization goals, generate and execute code, or use the infographic generation feature to create stylized graphics.
Core features of AI电子表格可视化
- Data Summarization
- Goal Generation
- Visualization Generation
- Visualization Editing
- Visualization Explanation
- Visualization Evaluation and Repair
- Visualization Recommendation
- Infographic Generation
User reviews
5.0
/ 50 reviews
5 stars
0
4 stars
0
3 stars
0
2 stars
0
1 stars
0
No reviews yet. Be the first to write one.
Similar products

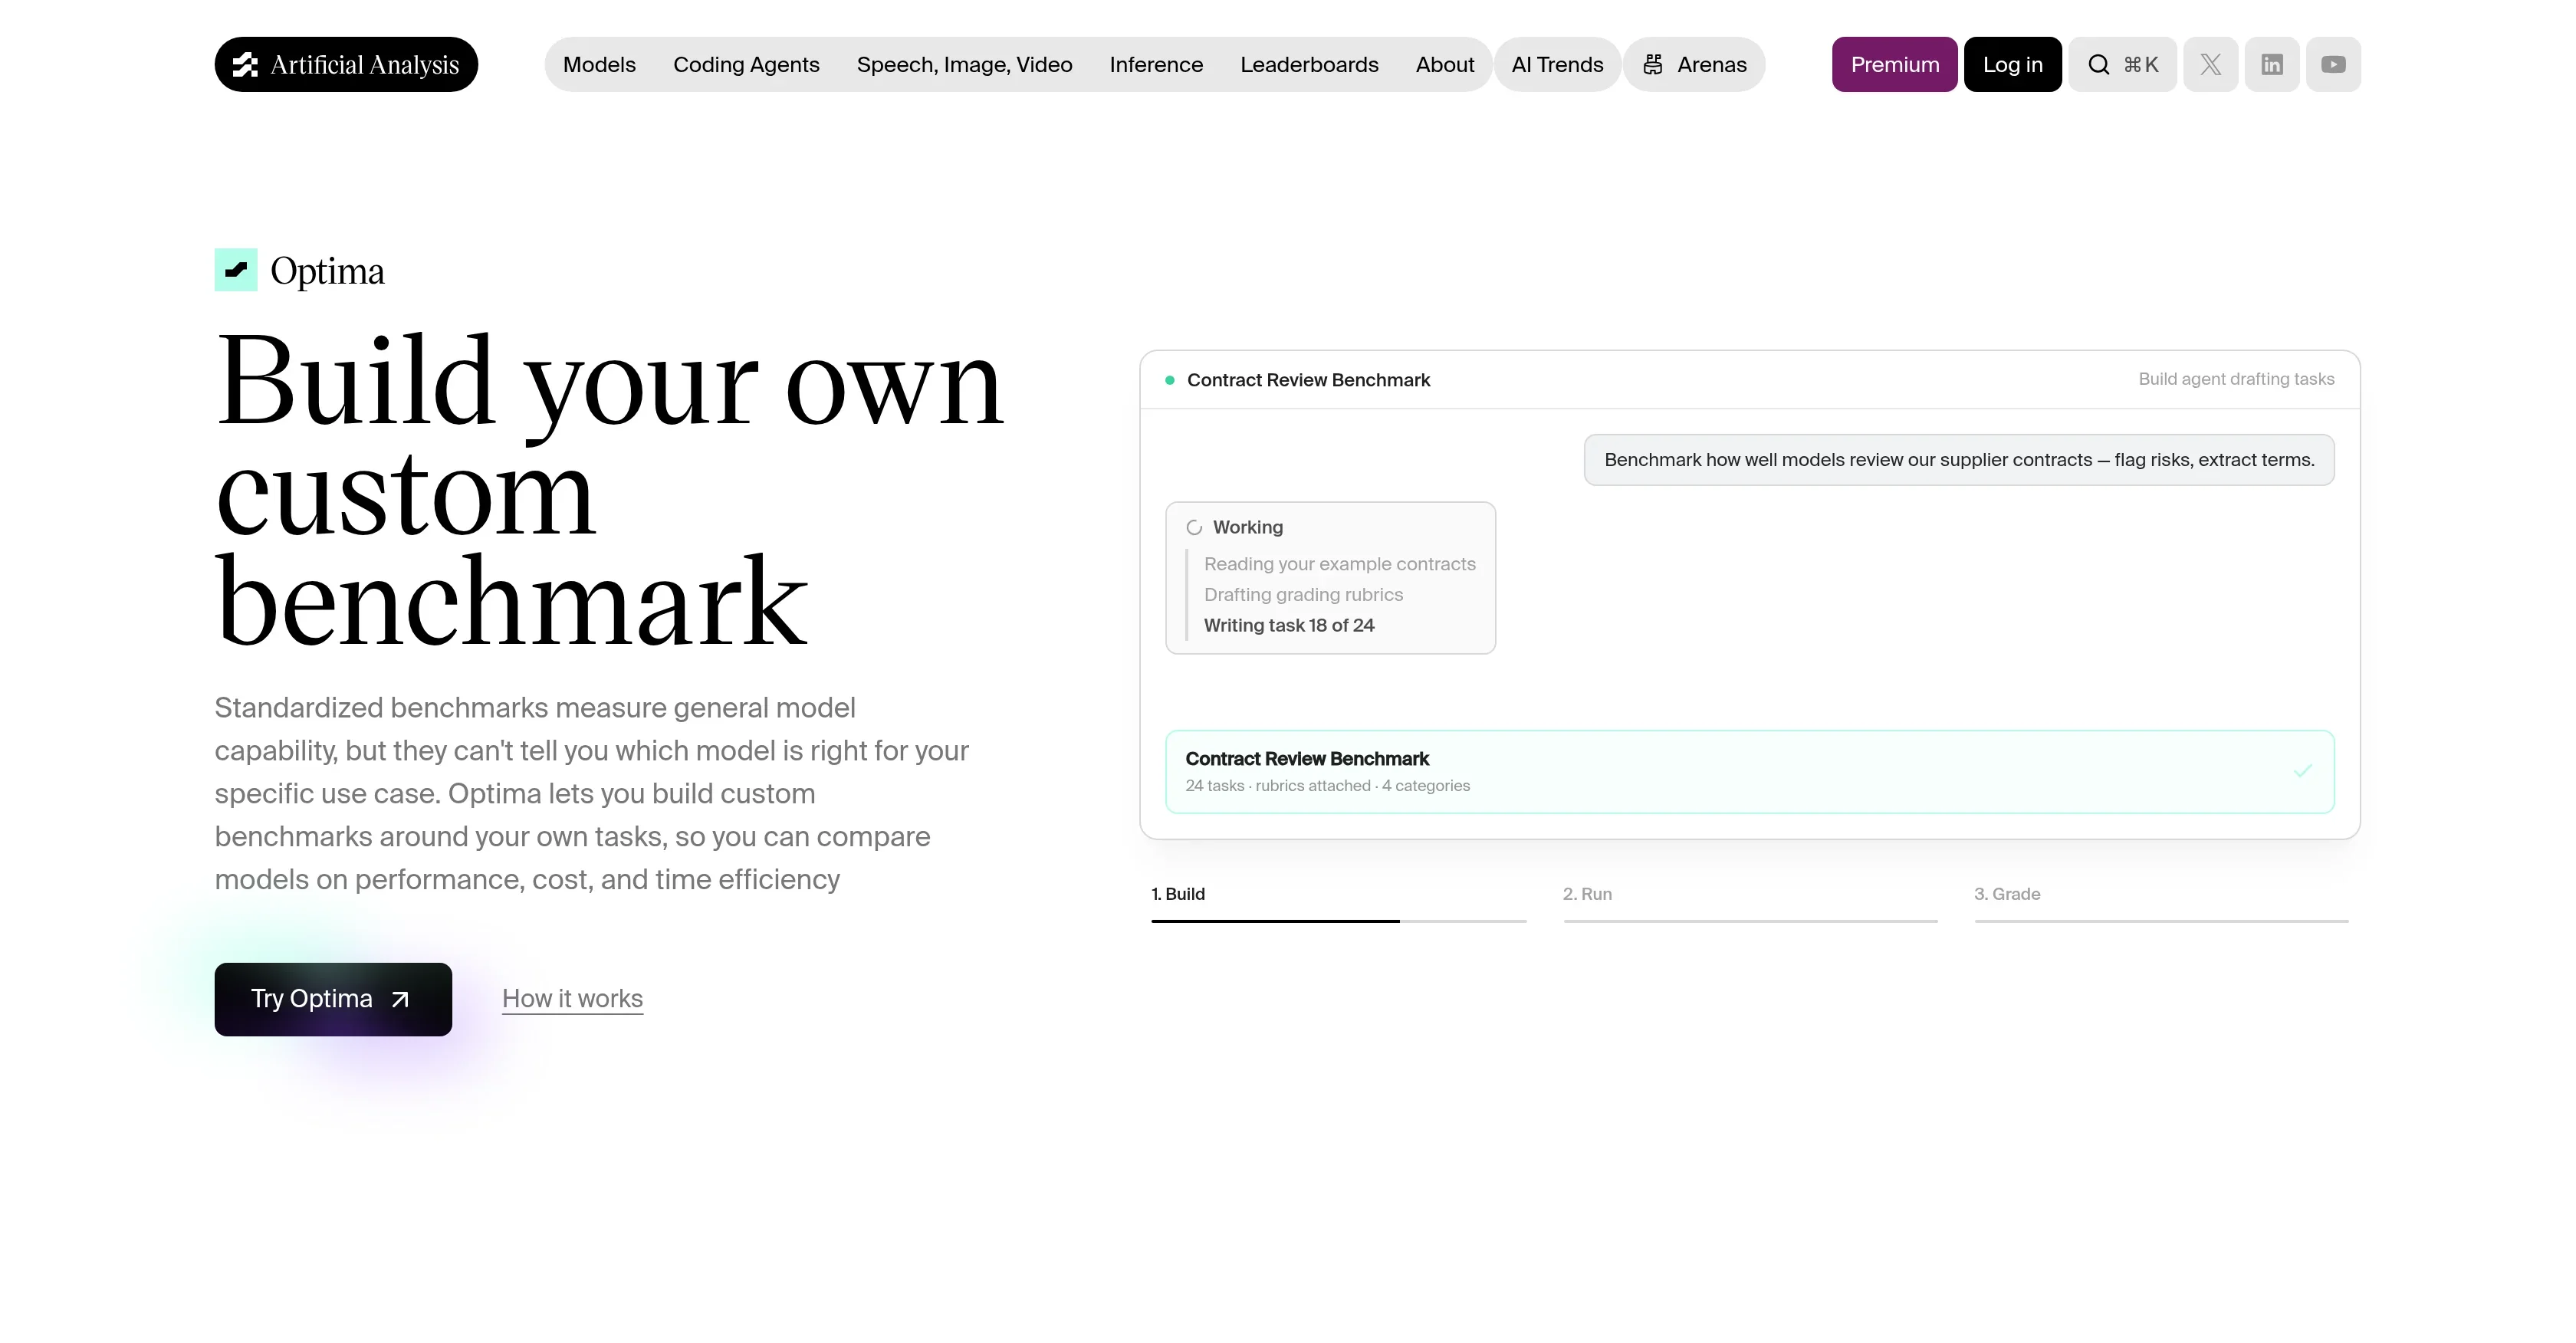
Optima by Artificial Analysis
05.0


Conversion Pattern
🇺🇸United States
05.0
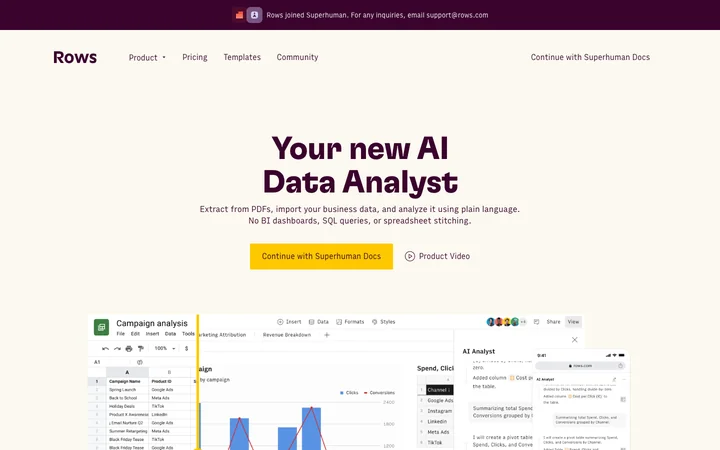
Copyright Your new AI Data Analyst Co
05.0
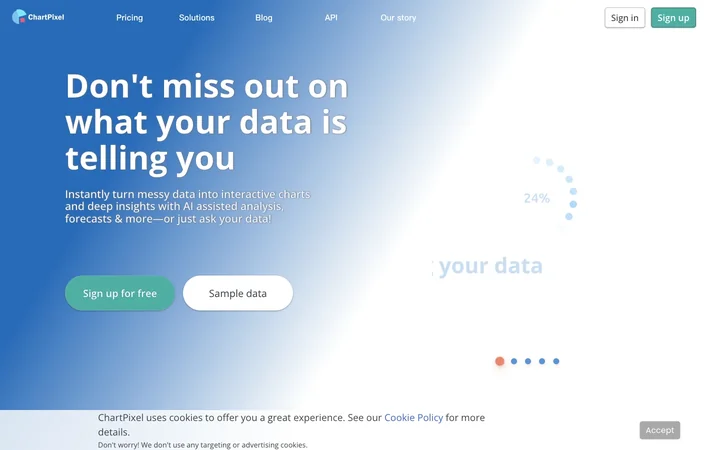
ChartPixel Ltd
🇬🇧United Kingdom
05.0
AI电子表格可视化 Embed
Add a website badge to show your product on Hootool—help others find the right AI tool for their problem. Easy to place on your homepage or footer.